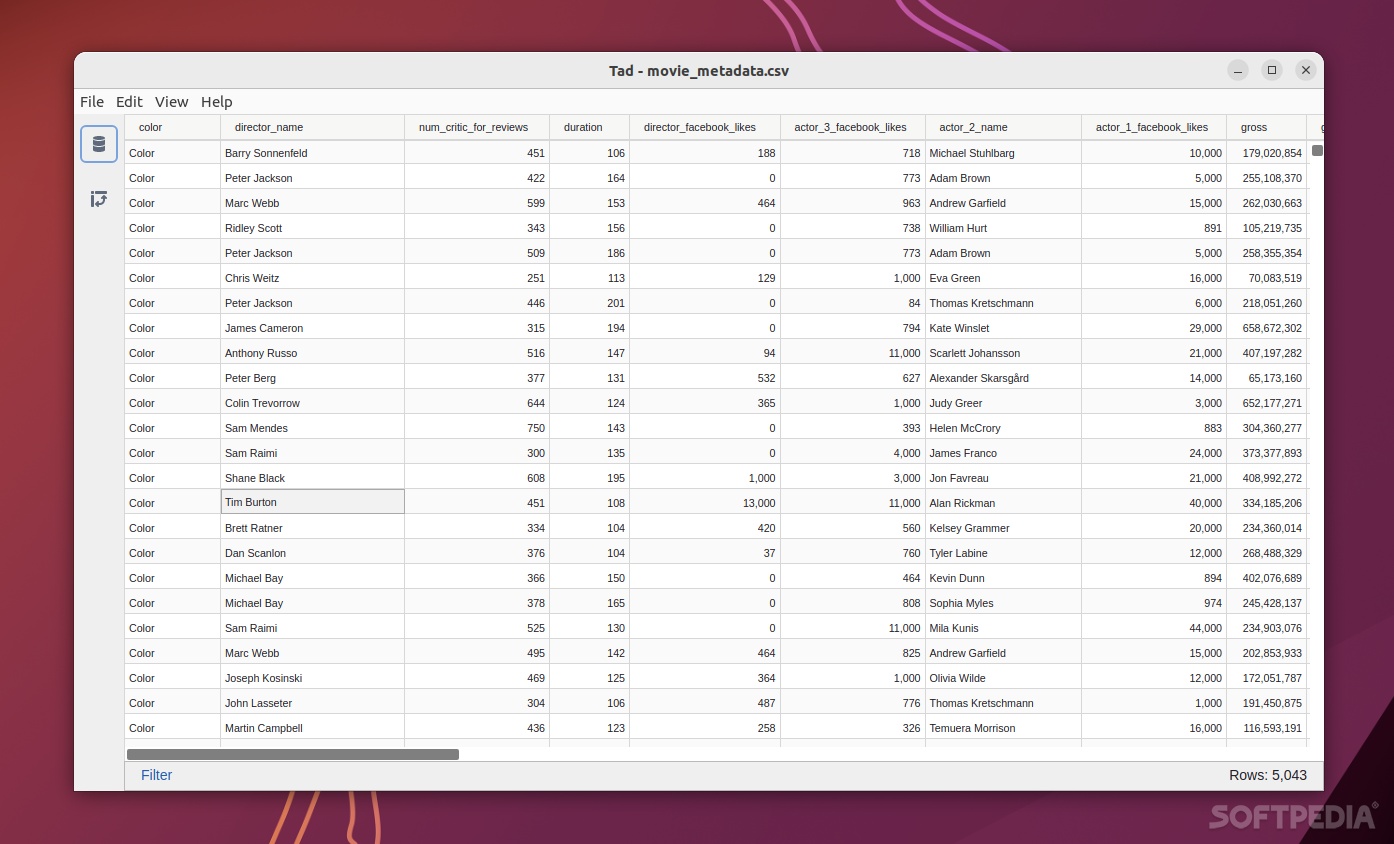

If you’re a data engineer or a data scientist, then you probably know the importance of tabular presentation of data. Being able to view and analyze data in a orderly and structured fashion can massive boost your productivity.
That’s exactly why Tad was created. Tad is a free and open-source application that allows you to view and analyze tabular data. More accurately, Tad is a sleek CSV file viewer that also works with (very) large files.
As mentioned above, it works with CSVs, but it also works with Parquet files, as well as with SQLite and DuckDb databases.
A React UI component that implements a hierarchical pivot table is at the core of Tad. This component allows you to specify various combinations of pivots, add filters, aggregate functions, as well as sort the data in various ways.
SQL queries are used to perform all analytic operations, and SlickGrid is used for rendering the data grid.
The Pivot Table is by far the most important GUI element of Tad. The application also allows you to construct filters (with a collection of predicates). The Filter panel can be activated by pressing the Filter button at the bottom of the main window.
Another great feature is the fact that you can combine operations. In short, you can combine different operations to explore the underlying data.
Other noteworthy features include the ability to add aggregation functions (Additional Properties -> Aggregations), to change the formatting of each column, as well as drag column names in the list of pivoted columns (in order to adjust the order).
Tad is an amazing application for viewing and analyzing tabular data sets. It may not look very stylish, but it’s modern, easy-to-use, and really well-thought-out.
